Large language models (LLMs) are revolutionizing how customers receive product recommendations as they search for products online. Leveraging an LLM allows for a deeper comprehension of product attributes and context, ensuring precise matches to customer preferences. By understanding product nuances and user needs, LLMs complement behavioral models, enriching recommendations with serendipitous discoveries and personalized suggestions.
In this article, we’ll demonstrate how to build a generative AI-powered product recommendation system using FlagEmbedding from Hugging Face and Teradata Vantage™ in the db_function VectorDistance. By passing product descriptions to the FlagEmbedding model, we’ll generate the embeddings and store it to calculate the VectorDistance.
Recommendation systems are a type of information filtering system that seeks to predict the rating or preference that a customer would give to an item. They’re often used on e-commerce websites to recommend products to customers based on their past purchase history, browsing behavior, and other factors. In this demo, we use product-to-product recommendations based on embedding distances. The VectorDistance function will return the closest products from the databases as recommendations.
The advent of semantic search, driven by embeddings and vector databases, marks a significant leap forward in information retrieval. Unlike traditional keyword-based searches, semantic search prioritizes context and relationships, resulting in more precise and relevant results. This approach has transformed search capabilities across diverse fields. The examples provided underscore the adaptability and effectiveness of semantic search powered by embeddings and vector databases, offering improved accuracy, context sensitivity, and personalized results.
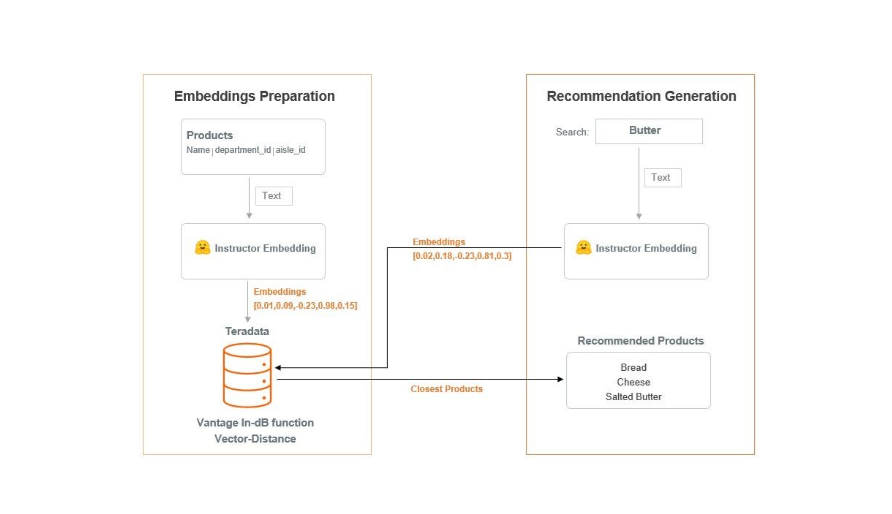
The following diagram illustrates the architecture.

Architecture of product recommendation
Before going any further, let’s get a better understanding of cosine similarity (distance measure method) and embeddings.
Cosine similarity
In natural language processing (NLP), a vector is a way of representing a word or phrase as a set of numbers so it can be understood by computers.
Cosine distance is a way of measuring the similarity between two vectors. It works by calculating the cosine of the angle between the two vectors. The cosine of an angle is a number between -1 and 1, where 0 means that the vectors are perpendicular, 1 means that they’re pointing in the same direction, and -1 means that they’re pointing in the opposite directions.
So, if you have two vectors that are very similar, the cosine of the angle between them will be close to 1. And if you have two vectors that are very different, the cosine of the angle between them will be close to 0.
Imagine you have several products, and you want to know how similar they are to each other. You could represent each product as a vector of numbers, where each number represents a different feature of the product. For example, you could have a vector for cheese that looks like this: [0.6, -0.2, 0.8, 0.9, -0.1, -0.7]. Once you have represented each product as a vector, you can use cosine similarity to measure how similar they are.
For example, the cosine of an angle would be close to 1 between cheese and butter, because they have many similar features and they both are dairy products. However, the cosine of an angle would be close to 0 or less than 0 between cheese and eggs, because they’re not as similar.

Embeddings
Embeddings are the AI-native way to represent any kind of data, making them the perfect fit for working with all kinds of AI-powered tools and algorithms. They can represent text, images, and soon audio and video. There are many options for creating embeddings, whether locally using an installed library or by calling an API.
Imagine you have several words, and you want to find a way to represent them in a way that captures their meaning. One way to do this is to create a word embedding. A word embedding is a vector of numbers that represents the meaning of a word. The numbers in the vector are chosen so that words that are similar in meaning have similar vectors.
For example, the words “cheese,” “butter,” “chocolate,” and “sauce” might have a vector that looks like the below:

Example of how vector distances work
The numbers in this vector don’t have any special meaning by themselves. They just represent the way that the word “cheese” is related to other words in the vocabulary.
We can use word embeddings to find the similarity between words. For example, we can calculate the cosine similarity between the vector for “cheese” and the vector for “butter.” The cosine similarity is a measure of how similar two vectors are, and it ranges from 0 to 1. A cosine similarity of 1 means that the two vectors are perfectly aligned, and a cosine similarity of 0 means that the two vectors are completely unrelated.
In this case, the cosine similarity between the vector for “cheese” and the vector for “butter” would be very high. This is because the words “cheese” and “butter” are very similar in meaning. They’re both foods that are made from milk, and they’re both often used in cooking. We can also use word embeddings to find related words. For example, we can find all the words that are similar in meaning to “cheese”. This would include words like “milk,” “cream,” “yogurt,” and “feta.”
Word embeddings are a powerful tool for natural language processing. They can be used for a variety of tasks, such as sentiment analysis, machine translation, and question answering. Imagine a bunch of points in a high-dimensional space. Each point represents a word, and the position of the point in space represents the meaning of the word. Words that are similar in meaning will be close together in space, and words that are different in meaning will be far apart.
Now, imagine that we take a slice through this high-dimensional space. This slice will be a two-dimensional space, and the points in the two-dimensional space will represent the word embeddings. The distance between two points in the two-dimensional space will be a measure of the similarity between the two words. In this way, word embeddings can be used to represent the meaning of words in a way that’s both compact and informative.
Steps to prepare the environment
To begin, let us prepare our environment for the application of the recommendation engine using Vantage’s in-database functions and the FlagEmbedding model. Regardless of your level of experience with data, let’s make the journey enjoyable.
1. Install sentence-transformers.
pip install sentence-transformers
2. Set up your database.
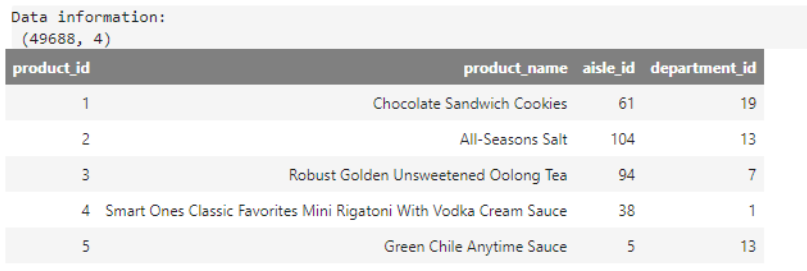
The data for this demo comes from the products table of Instacart. We’ll only use the products table.
The products table contains information about all products available on Instacart (product ID, product name, etc.). The table also includes the product’s department and aisle, which can be used to group products together.
Each row is a snapshot of data taken from the products table. Below are the columns in the product table:
- product_id
- product_name
- aisle_id
- department_id
The source data from Kaggle is loaded in Vantage with a table named Products.
tdf = DataFrame(in_schema('DEMO_Grocery_Data', 'products'))

print("Data information: \n",tdf.shape)

tdf.sort('product_id')

Sample of data from the products table
3. Generate embeddings for the product table.
To generate embeddings for a product table, we’ll use the FlagEmbedding repo from Hugging Face, which uses the BAAI/bge-large-en model to generate embeddings. FlagEmbedding is a type of word embedding that can be used to represent products in a way that captures their semantic meaning. This means the embeddings will reflect the product name's meaning, not just the words used. Please refer to the Embeddings documentation for more information about embeddings.
The FlagEmbedding takes a text string as input and returns a vector of numbers that represent the embedding. The length of the vector depends on the model that you are using. For example, the BAAI/bge-large-en model returns a vector of 1024 numbers.
In this demo, we’ll use BAAI/bge-large-en as the model, which is ranked first in the MTEB leaderboard.
To generate the embeddings, we’ll call the get_embeddings_hf() function. This function will convert the Teradata DataFrame to a Pandas DataFrame and generate the embeddings. Once the embeddings are generated, we’ll store them in separate columns so that we can pass them to the VectorDistance() function later on.
import teradataml

from teradataml import *

import pandas as pd

from FlagEmbedding import FlagModel

from sentence_transformers import SentenceTransformer


# model = FlagModel('BAAI/bge-large-en', query_instruction_for_retrieval="Represent this sentence for searching relevant passages:")

model = SentenceTransformer('BAAI/bge-large-en')


def get_embeddings_hf(tdf):


result_df = tdf

# convert to pandas df if teradataml.dataframe

if type(tdf) == teradataml.dataframe.dataframe.DataFrame:

result_df = result_df.to_pandas().reset_index()


# encode

def get_emb(s):

# return model.encode(sentence)

return model.encode(s, normalize_embeddings=True)


# This may take a few minutes

result_df["embedding"] = result_df.product_name.progress_apply(lambda x: get_emb(x))


# Generate all the embeddings columns from the "embeddings" column.

for i in range(1024):

result_df["embeddings_{}".format(i)] = result_df["embedding"].apply(lambda x: x[i])


# # drop embedding

result_df.drop("embedding", axis=1, inplace=True)


return result_df
Now, let’s call the above function in batches to generate the embeddings on the product name column.
def recursive_emb_generator(table_name, file_name, chunksize=100):

wallclock_time_start = timeit.default_timer()


# delete the records

delete_emb_from_sql(table_name, eng)


# Read the data in chunks of 1000 rows

temp_df = pd.read_csv(file_name, chunksize=chunksize)


# Iterate over the chunks

for chunk in tqdm(temp_df, desc="Overall progress ",):

print("Data size in current chunk: ", chunk.shape)

df_chunk = get_embeddings_hf(chunk)


copy_emb_to_sql(table_name=table_name, tdf=df_chunk)

print(f"{df_chunk.shape[0]} products saved to sql \n")


wallclock_time_end = timeit.default_timer()

wallclock_time = wallclock_time_end - wallclock_time_start

print('wallclock time:\t', wallclock_time)

print('-'*50,' complete ', '-'*50)


df_snacks = tdf_sample.to_pandas().reset_index()

df_snacks.to_csv('df_snacks.csv', index=False)


recursive_emb_generator(table_name="product_embeddings_os", file_name='df_snacks.csv', chunksize=100)
4. Display the product embeddings.
product_embeddings_os = DataFrame(in_schema('demo_user', 'product_embeddings_os'))

print("Data information: \n",product_embeddings_os.shape)

product_embeddings_os
We can see that generated embeddings for all of the products are in the vector of 1,024 columns.
For example: The generated embeddings for the product name: Chocolate Sandwich Cookies consists of 1,024 numbers and appears as:
-0.008196 0.012901 0.008759 -0.002950 -0.019805 -0.010412
Now, we’ve generated the embeddings from the product names and saved the product embeddings dataframe into a Vantage table named product_embeddings_os to use it further.
5. Get the embedding for a few products search terms.
Let’s take 10 random products from the same department to check their recommended products from our database. To do this, we need to follow the same process as before: generate the embeddings for the products and store them back to the Vantage table.
tdf_search_products = tdf.loc[tdf['department_id'] == 19].tail(10)


print(tdf_search_products.shape)

tdf_search_products.sort('product_id')
Now, repeat the same steps to produce the embedding for the above products.
start = timeit.default_timer()

df_search_products = get_embeddings_hf(tdf_search_products)

end = timeit.default_timer()

load_time = end - start

print(f'generate the embeddings for {df_search_products.shape[0]} search products:\t', load_time)

print('----- complete -----')


# Print the DataFrame.

df_search_products.head()
Since the product names were searched, we’ve now generated the embeddings. The product embeddings dataframe must therefore be saved into a new table called search_product_embeddings_os before we can utilize it further.
6. Calculate VectorDistance using the Vantage in-DB function.
The TD_VectorDistance function accepts a table of target vectors, and a table of reference vectors and returns a table that contains the distance between target-reference pairs.
The function computes the distance between the target pair and the reference pair from the same table if you provide only one table as the input.
The VectorDistance function calculates the distance between a target vector and a reference vector. We use the cosine distance metric, which measures the similarity between two vectors. The function can return the maximum of 1 to 100 closest reference vectors to include in the output table for each target vector. In this demo, we want the top 2 closest reference vectors to the target vector.
The VectorDistance function has a parameter distance_measure. You can pass anyone from the list below. The default value is cosine.
- Cosine distance measures the similarity between two vectors by calculating the cosine of the angle between them. It’s a good measure of similarity for high-dimensional data, as it’s not affected by the magnitude of the vectors.
- Euclidean distance measures the distance between two points in a Euclidean space. It’s the most common distance measure, and it’s a good measure of similarity for low-dimensional data.
- Manhattan distance measures the distance between two points in a Manhattan space. It’s similar to Euclidean distance, but it uses the absolute value of the difference between the coordinates instead of the square of the difference.

Types of distance measures
The below function: TD_VECTORDISTANCE will calculate the VectorDistance.
def calculate_vector_distance(target_table, reference_table, emb_column_names, topk):

start = timeit.default_timer()


query = f'''

SELECT

target_id,

reference_id,

distancetype,

cast(

distance as decimal(36, 8)

) as distance

FROM

TD_VECTORDISTANCE (

ON {target_table} as TargetTable

ON {reference_table} as ReferenceTable Dimension

USING TargetIDColumn('product_id') TargetFeatureColumns{tuple(emb_column_names) }

RefIDColumn('product_id')

RefFeatureColumns{tuple(emb_column_names) }

DistanceMeasure('cosine')

topk({topk})

) as dt

order by 3, 1, 2, 4;

'''


vector_distance_df = pd.read_sql(query, eng)


end = timeit.default_timer()

load_time = end - start

print(f'vector-distance calculation time:\t', load_time)

print('----- complete -----')

return vector_distance_df


emb_column_names = DataFrame(in_schema('demo_user', 'search_product_embeddings_os')).columns[4:]


# select top matching

number_of_recommendations = 4


vector_distance_df = calculate_vector_distance(

target_table= "search_product_embeddings_os",

reference_table="product_embeddings_os",

emb_column_names=emb_column_names,

topk = number_of_recommendations)
7. Display the recommended products.
To view the recommendations, we need to join two tables together. First, we’ll join the vector distance result table with the product embeddings table. This will give us a table that contains the vector distance scores for each product as well as the product embeddings. Then, we’ll join this table with the search products table. This will give us a final table that contains the recommendations for the search products.
def get_final_recommendations(vector_distance_df, product_embeddings_df, search_product_embeddings_df):

product_embeddings_df_selected_columns = product_embeddings_df.select(["product_id", "product_name"]).to_pandas().reset_index()


# join vector-distance results and products

vec_prod_join_result = pd.merge(vector_distance_df, product_embeddings_df_selected_columns, left_on='reference_id', right_on='product_id', how='inner')


# join the above joined table with search products

vec_prod_join_result_selected = vec_prod_join_result[["product_id","product_name", "target_id","distancetype","distance"]]


# join_result_sorted_selected

df_search_products_selected = search_product_embeddings_df.select(["product_id", "product_name"]).to_pandas().reset_index()


# recommendation results

df_recommendations = pd.merge(df_search_products_selected, vec_prod_join_result_selected, left_on = "product_id", right_on="target_id", how = "inner", suffixes=["_search", '_recommended'])


# sort by distance

df_recommendations = df_recommendations.sort_values(["product_id_search", "distance"], ascending=True).reset_index()

return df_recommendations[['product_id_search', 'product_name_search','product_id_recommended', 'product_name_recommended', 'distance']]


product_embeddings_df = DataFrame(in_schema('demo_user', 'product_embeddings_os'))

search_product_embeddings_df = DataFrame(in_schema('demo_user', 'search_product_embeddings_os'))


# get topk final recommendations for each searched products

df_recommendations = get_final_recommendations(vector_distance_df, product_embeddings_df, search_product_embeddings_df)

df_recommendations.head()
In the table below, we can see the recommended products based on the customer’s search. The cosine distance between the searched and recommended products is also shown. Note that a few products have a cosine distance of zero. This is because the cosine distance is calculated by comparing the vectors of the two products. If the two products are the same, then the cosine distance will be zero.

Recommendations for the products searched by the customer
Product recommendations
Based on your search for Pomegranate Gummy Bears, here are some recommended products:
- Pomegranate Gummy Bears
- Gummy Bears
- Organic Gummy Bears
- Organics Gummy Bears
Based on your search for Sandies Pecan Shortbread Cookies, here are some recommended products:
- Sandies Pecan Shortbread Cookies
- Pecan Shortbread Cookies
- Sandies Classic Shortbread Cookies
- Sandies Toffee Shortbread Cookies
Based on your search for Mac n’ Cheese Puffs, here are some recommended products:
- Mac n’ Cheese Puffs
- Cheese Puffs
- Puffs Cheese Flavored Snacks
- Flamin’ Hot Cheese Flavored Puffs
In the above list, we can see the recommendations for the searched product.
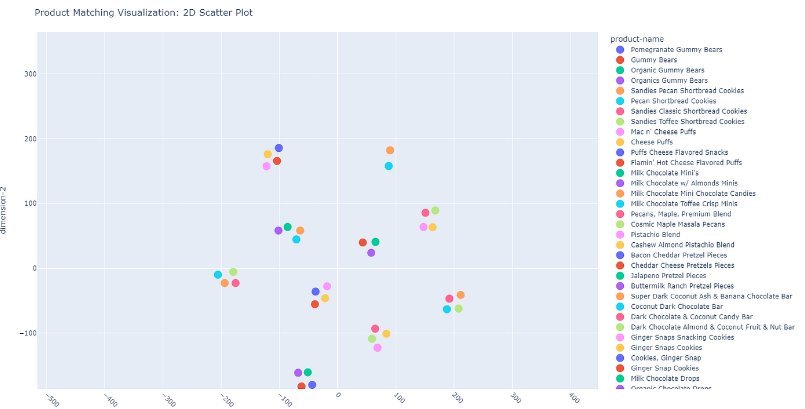
8. Visualize product matching in a 2D scatter plot.
A product distance scatterplot is a data visualization tool that can be used to identify and analyze the relationships between different products. The scatterplot plots each product as a point on a two-dimensional plane, with the x-axis and y-axis representing two different product features or characteristics. The distance between two points on the scatterplot represents the similarity between the two products based on the chosen features.

2D Scatter plot
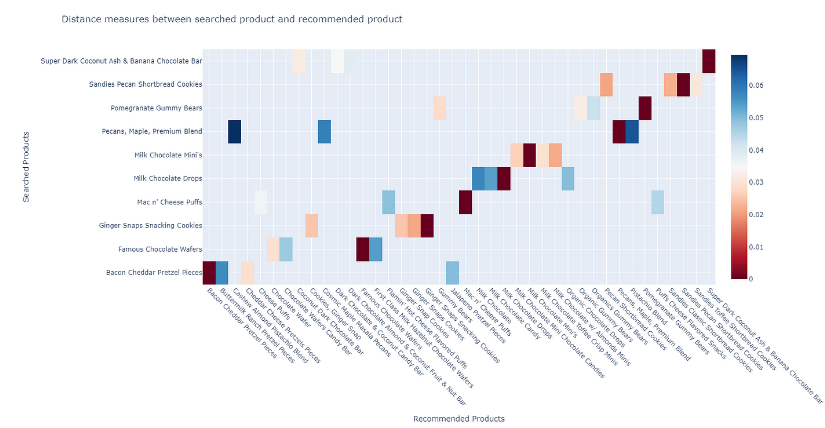
9. View product relationships in a product distance heatmap.
The product distance heatmap provides a visual representation of the relationships and distances between different products. This heatmap offers valuable insights into how products relate to each other, helping businesses make informed decisions regarding product placement, clustering, or other strategic considerations.

Distance measures heatmap
Conclusion and next steps
In conclusion, product recommendation using embeddings and Vantage’s in-database analytics function, VectorDistance, is a powerful approach for businesses to enhance their customers’ shopping experience and increase sales. Ultimately, LLMs bridge the gap between customer intent and product features, delivering tailored and engaging recommendations based on a holistic understanding of products and user interactions. By leveraging the capabilities of vector embeddings and the Vantage database, businesses can provide personalized product recommendations that are tailored to each customer’s preferences and interests.
For those who are eager to explore the code and experiment further, the complete source code is available on GitHub, providing a valuable resource for developers and data scientists alike. The code is well organized and easy to follow, making it an excellent starting point for anyone looking to build upon this work or learn from it. Whether you are interested in adapting the code for your use case or simply want to understand how it works, the GitHub repository is an invaluable resource.
If you have any questions or suggestions, please feel free to send me a message on LinkedIn. I would also like to invite you to explore the Teradata Developer Portal.
Discover the art of crafting a cutting-edge, AI-driven product recommendation system that leverages the power of embeddings and Teradata's innovative in-database technology. The code for this demo is available on GitHub. Take a look for a more detailed understanding of the implementation.
