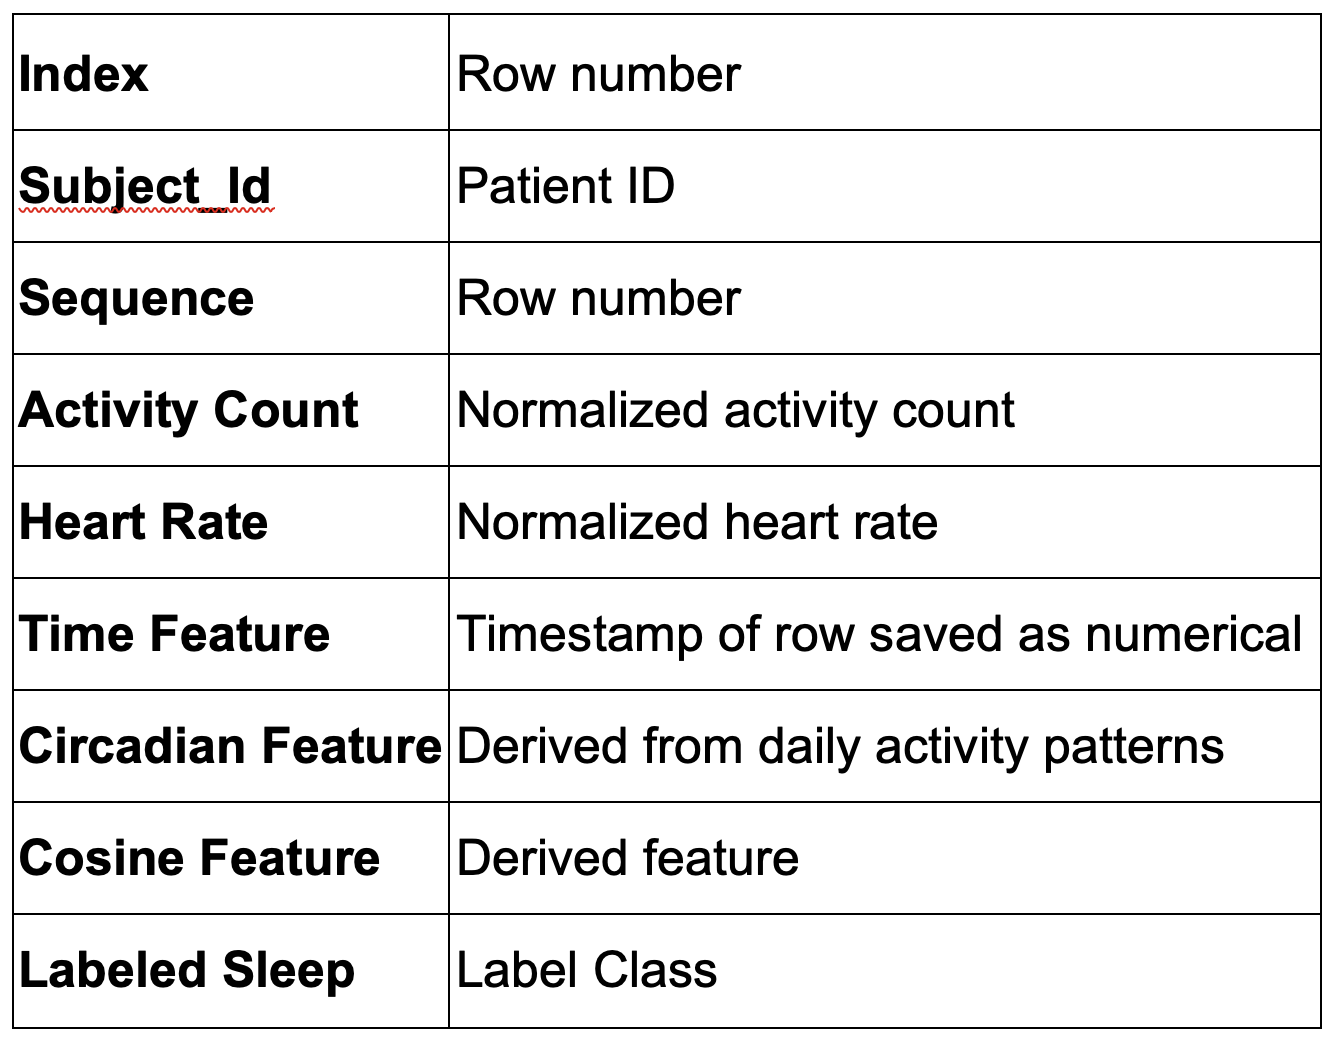
The features present in this data set are shown below in a tabular format.
 The data was labelled with the following stages of sleep.
 The numbers given below represent the class distribution of the labels. A clear balance can be seen in the class distribution. This would be cause bias in the result.
Class distribution
Furthermore, inconsistency in the number of datapoints per subject was also observed during the analysis.The diagrams below show scatterplots of the features in the dataset namely heart rate, Activity Count, Circadian Feature, Cosine Feature, and Time. Both Activity Count and Heart rate show a fairly uniform distribution of records whereas circadian feature and cosine feature show parabolic curves. The time feature is linear as its values are incremental.
 A simple correlation matrix as shown below helped identify features like cosine feature, index, and activity count. These features were dropped from the actual analysis.
 Correlation Matrix
Methodology to overcome inconsistency
To overcome the data inconsistency problem (over the subjects and classes) time series forecasting was used for data imputation and feature engineering.
The subjects were scanned to find the optimal time-series length needed for the analysis. Once this was determined, the data for each subject was imputed based on how many observations were needed w.r.t to the optimal length (calculated by a simple difference).
So the first part of the process was to utilize time-based algorithms like Facebook Prophet, to impute/extrapolate time series for all measures based on the longest time series available. This would ensure time series of equal length, for every individual and eliminate bias.
The dataset was split into test and train per subject using 80/20 rule. Then the classification algorithms were applied to the new data set and the performance metrics were compared to the original data set.

Prophet and Data Imputation
Prophet is an open-source forecasting library developed by Facebook to facilitate data scientists to perform multivariate time series forecasting. Prophet uses additive regression at its backend and utilizes Fourier Series to model a yearly seasonal component. It also uses other components like piecewise linear or logistic growth trends. The user also has to provide the grain of time (Weekly, Yearly, Monthly, Daily, Hourly) that is to be predicted.
We have used Prophet for data imputation because it is a tool that has countless testimonies to support its performance.
We show below some of the examples of data imputation on particular features.
The graphs below show the forecasting of the feature, heart rate. In the first graph, the grain on the x-axis is the date. The black dots represent the balanced time series. The green dots represent the test set to be predicted. The blue line is the actual prediction against the test set. The second graph below shows the same analysis but at a finer detail (Time Stamp). It can be seen in the second graph that the forecast data mimics the test dataset. Further analysis on the performance metrics like RMSE and R2 would tell the actual story. This type of imputation was done for important features in the dataset.
 Classification
Logistic regression was used as a basic algorithm on the pre-imputed dataset to set a baseline. The results below show poor performance in terms of F1 score for classes 0, 1, 3, 4, and 5 mainly because of the imbalance in the classes.

Base Test (Logistic Regression) - Before Imputation
Random forest was used as the main algorithm for the project. The before and after results/performance metrics show the stark difference between pre-imputed and post-imputed data. The increase in support metric for class 0 supports the increase in the F1 score for that particular class. Other classes that showed a significant increase were class 1 and class 4 (Table 2). An increase in the macro average and the weighted average was also seen.

Future Work
This project has potential for future work.
- Addition of effective visualizations which would give the project an uplift in terms of better insights.
- The data set can be further enhanced by incorporating geography data, subject’s age, gender, health-related data and weather data.
- Enhancing the data set would improve the performance measures.
- Implementation of cross-validation methods would also ensure better confidence in the results.
References
-
Goldberger, A., Amaral, L., Glass, L., Hausdorff, J., Ivanov, P. C., Mark, R., ... & Stanley, H. E. (2000). PhysioBank, PhysioToolkit, and PhysioNet: Components of a new research resource for complex physiologic signals. Circulation [Online]. 101 (23), pp. e215–e220.
-
Teradata Data Science Hackathon (11-Feb-2021)

.jpg?origin=fd&width=100)